

It may be helpful to view Labor Force Participation Rate, Employment-Population Ratio, Job Quality Index, and homelessness as a complex dynamic system, each affected by many variables. This is the approach taken in this hypothesis, focusing on the H-1B (primary) and unlawful immigration (secondary) variables.
There are STEM professionals who are homeless (This Millennial Software Engineer Wound Up Homeless) or facing homelessness (A 55-Year-Old Developer Tells Us What It’s Like To Face Homelessness In A Youth-Obsessed Silicon Valley).
Given that 74% of Homeless People Are NOT Drug Addicts, and California ranks first in H-1B, unlawful immigration, and homelessness levels, it begs the question – is there a relationship between the three? Obviously there are many other variables involved in homelessness – the questions here are does H-1B and/or unlawful immigration increase the probability of homelessness, and why?
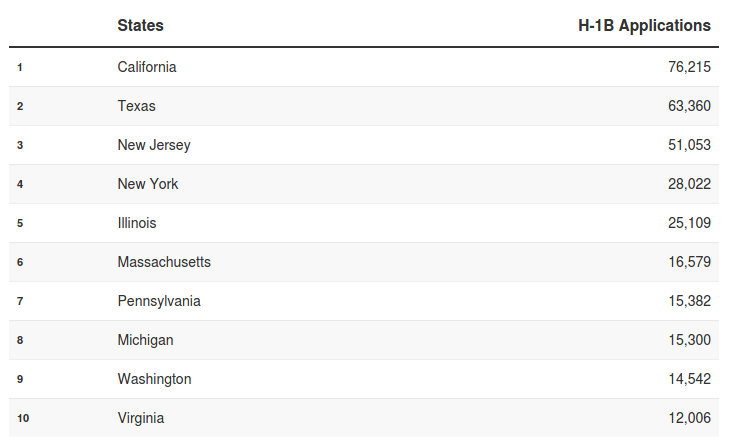
H-1B Visa Program: Top U.S. States for Applications
Note – the above are applications, not actual H-1B workers displacing American workers. Ranks all 50 states for H-1B applications. Using these numbers for analysis.
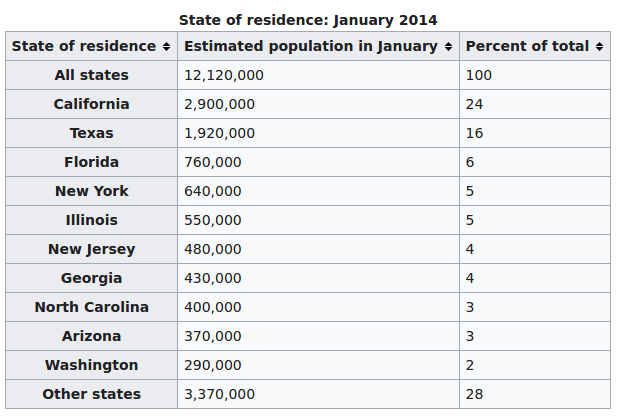
Illegal immigration to the United States Top 10 states with the most unlawful immigrants. Estimated 300,000 enter annually.
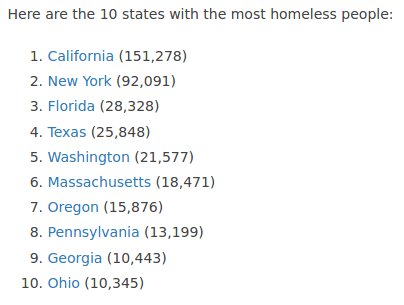
Homeless Population by State 2020 Includes list of top 10 homelessness states, as well as each state’s number of homeless people. Bear in mind the above are based on absolute numbers, not percent of population.
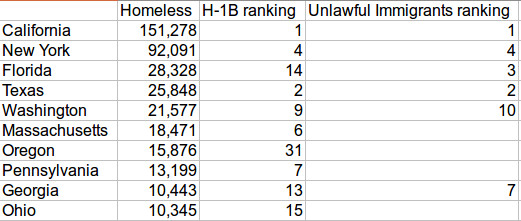
From the above sources, put together a table listing top 10 states’ homelessness levels, H-1B ranking, and unlawful immigration ranking.
Note – 8 of the 10 states with the highest homelessness levels are also the top 10 states for H-1B and/or unlawful immigration, suggesting high H-1B and unlawful immigration levels increase the probability of homelessness.
Are Labor Force Participation Rate (proportion of the civilian working-age population working or searching for work), Employment-Population Ratio (proportion of the civilian working-age population that is employed), and Job Quality Index (ratio high paying jobs:low paying jobs) the metrics most impacted by high H-1B (as well as F1 OPT/CPT, J-1 for unmatched doctors, L-1, etc; attacking higher pay scales) and unlawful immigration (attacking lower pay scales; in desperation some displaced STEM professionals also compete for these jobs) levels, thereby driving homelessness? Are these are the whys?
Obviously there are other homelessness variables as well: local housing costs (which can be impacted by demand due to immigration); family support; available local safety net; is the state’s climate more/less tolerant of homelessness. Other possible Labor Force Participation Rate, Employment-Population Ratio, and Job Quality Index variables: age discrimination; education/skills level; impact of manufacturing (and other jobs) offshoring; was the state dependent on a now dying industry such as coal; others. These other variables of both categories could explain outliers such as Ohio and Oregon.
New Jersey would be appear to be another outlier with its high H-1B and unlawful immigration levels compared to its low number of homeless relative to California – until one looks at other factors. New Jersey’s homeless is 0.1% of its population, California’s 0.38%. Still a significant difference, but not as great when looking at absolute numbers. Another possible variable – New Jersey is home to many H-1B “Bodyshops” who may be working in other states, whereas California’s Silicon Valley direct hires many of its H-1B workers. Plausibly the H-1B/Homelessness relationship still holds in New Jersey. Looks like may need to add a coefficient relating to Bodyshops sending H-1B to other states. A third possibility is people are leaving New Jersey before they become homeless – 4 of the top 10 H-1B states (California, New York, New Jersey and Illinois) lead in residents leaving (Census expected to prove that yes, people are fleeing NJ and NY for cheaper places to live) – another variable for the equation.
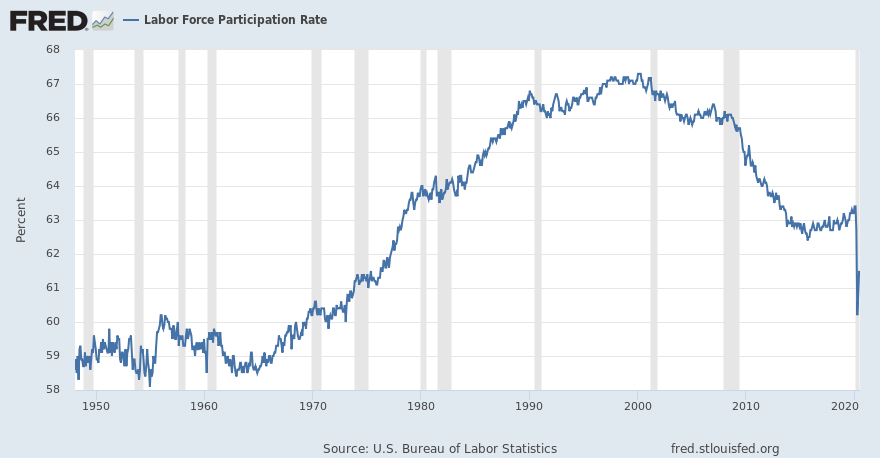
California’s labor force participation rate Comparing the national Labor Force Participation Rate and Employment-Population Ratio FRED graphs with California, California appears slightly below national average, suggesting a relationship between H-1B/unlawful immigration and Labor Force Participation Rate/Employment-Population Ratio.
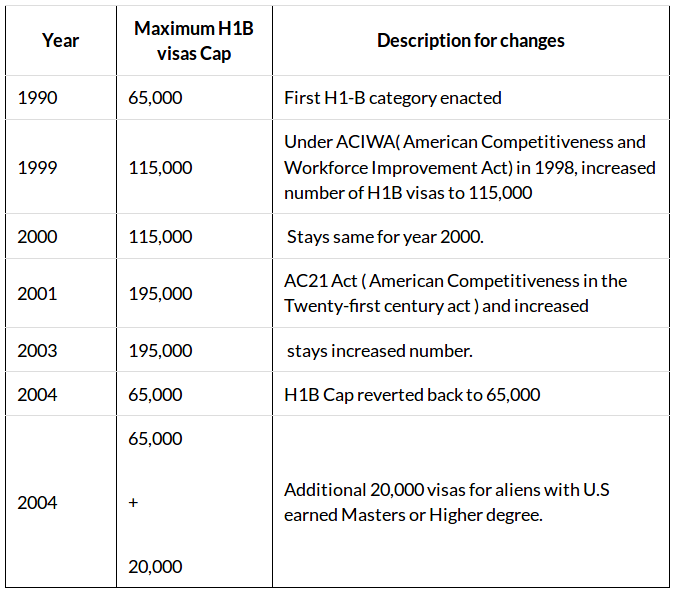
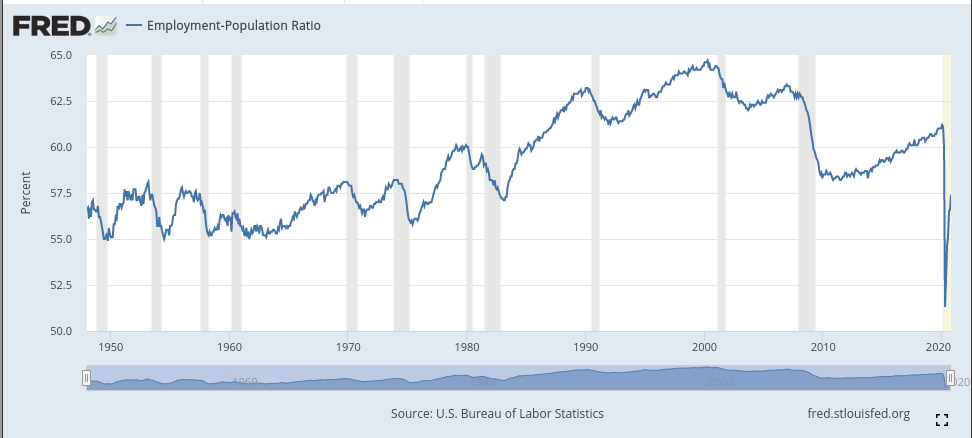
Also compare Labor Force Participation Rate and Employment-Population Ratio FRED graphs with H-1B Cap history. When one allows for lag time, there is some correlation between them. AC21 Act also adds H-1B Cap Exempt Category (Updated With Nov. 18, 2016 Rules: H1B Cap-Exempt Employment) for non-profit Education/Research organizations – further fueling Employment-Population Ratio drop?
Was the 2007 Microsoft and DHS expansion of F1 OPT/CPT as a H-1B alternative one factor in the slight drop in Employment-Population Ratio prior to the Great Recession? Was its growth one factor in the anemic Employment-Population Ratio growth during the recovery?
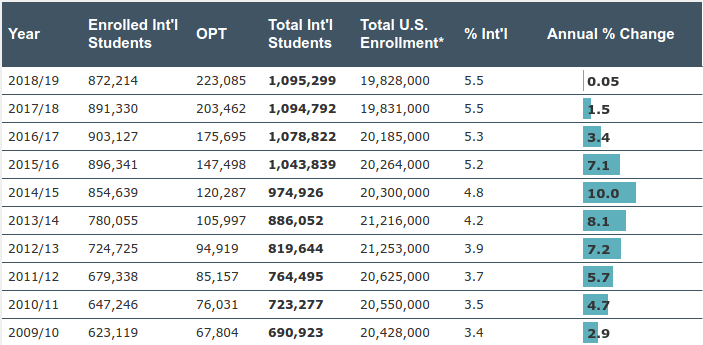
(image retrieved 07/11/20 from Institute of International Education)
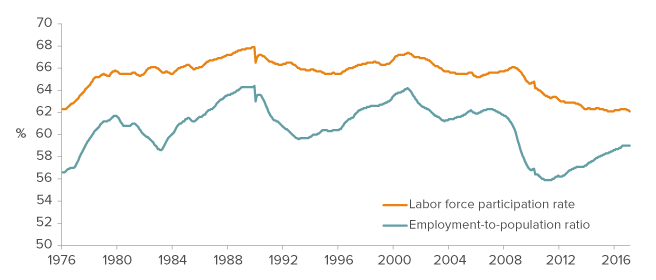
L-1 visas (Intra-Company transfer, L-1A & L-1B; can be used by H-1B Bodyshops with offices in India) existed at least since 2010 (74,719 approved; blanket approvals also available; L-1 visa); possibly 1 factor in further declining Labor Force Participation Rate, possible factor in sluggish Employment-Population Ratio growth during the recovery . Like the H-4 EAD, L-2 EAD available for dependent spouses.
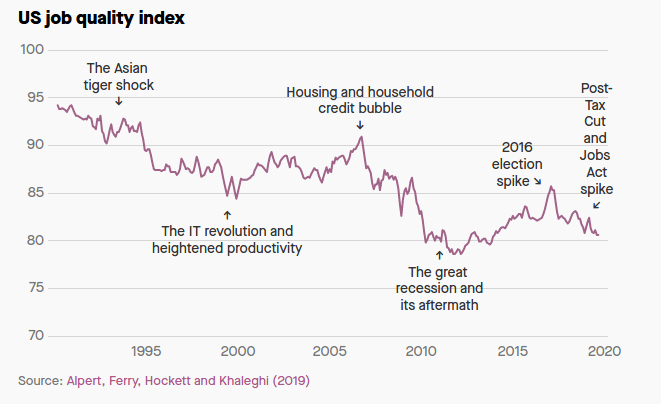
The great American labor paradox: Plentiful jobs, most of them bad
America’s Job Quality Index (ratio high paying jobs:low paying jobs) has yet to recover its 1990 high (some possible correlations to above H-1B Caps chart).
While article does not specifically mention H-1B, it does mention many salient points about globalization and job creation in America.
“Since 1990, America has cumulatively added some 20 million low-quality jobs, versus around 12 million high-quality ones. In short, the US economy has shifted toward creating more bad jobs than good.” 1990 – the inception of H-1B.
“late 1980s and early 1990s . . . added more than a billion workers to the world’s labor pool under a single global capitalist system” – same time the spread between Real Median Household Income and Real GDP per capita emerged (below graph), Job Quality Index began declining.
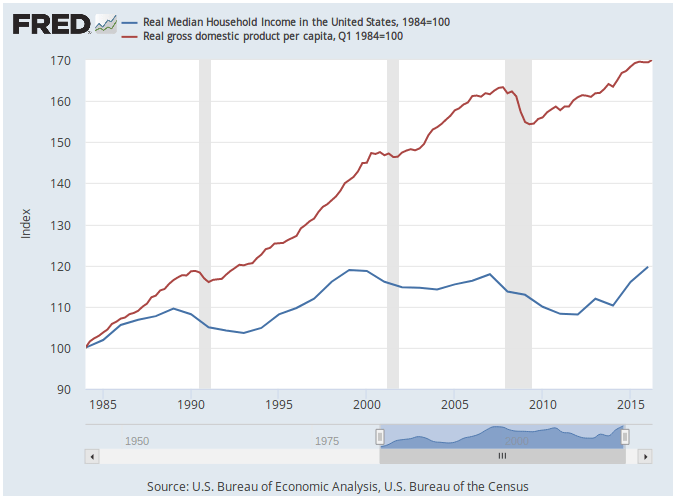
Since wages are the primary Job Quality Index variable, let’s examine Real Median Household Income and H-1B caps (granted, H-1B caps are not the only variable affecting income). H-1B was implemented 1990, slight drop in Real Median Household Income. 1999 saw the American Competitiveness and Workforce Improvement Act raising H-1B to 115,000 with another drop in Real Median Household Income. 2004, H-1B cap drops back to 65,000, slight up tick in Real Median Household Income. A few years later, Department of Homeland Security implements F1 OPT as an uncapped H-1B alternative; Real Median Household Income drops again. About 2014 both Real Median Household Income and Employment-Population Ratio start to rise.
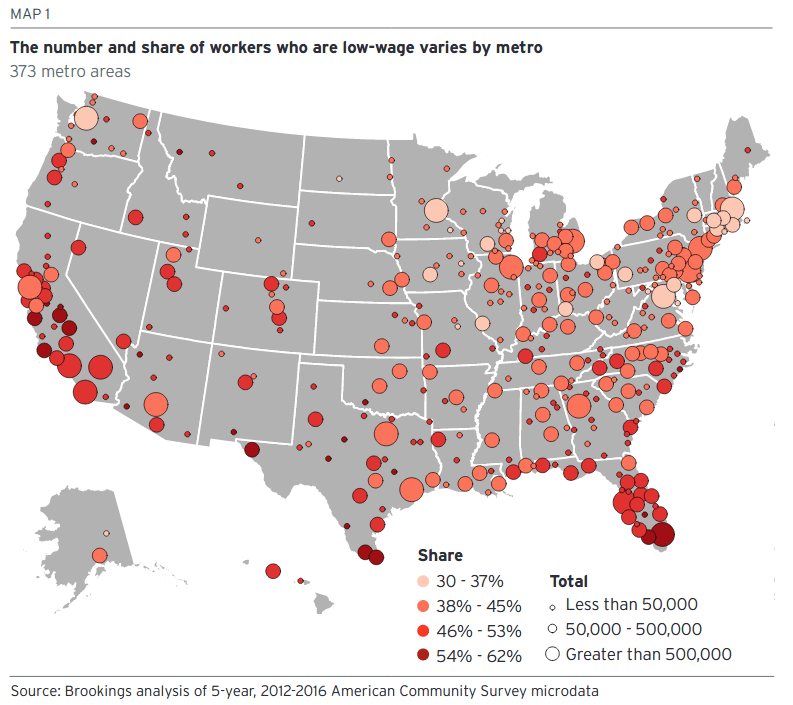
Meet The Low-Wage Workforce, p.35
Comparing the map of low Job Quality Index workers with the top 10 states for homelessness and/or H-1B and/or unlawful immigration we see some correlation, especially in California and Florida. High H-1B using Pennsylvania (ranked 7th homeless), New Jersey and New York (ranked 2nd homeless) have multiple pockets of low Job Quality Index workers.
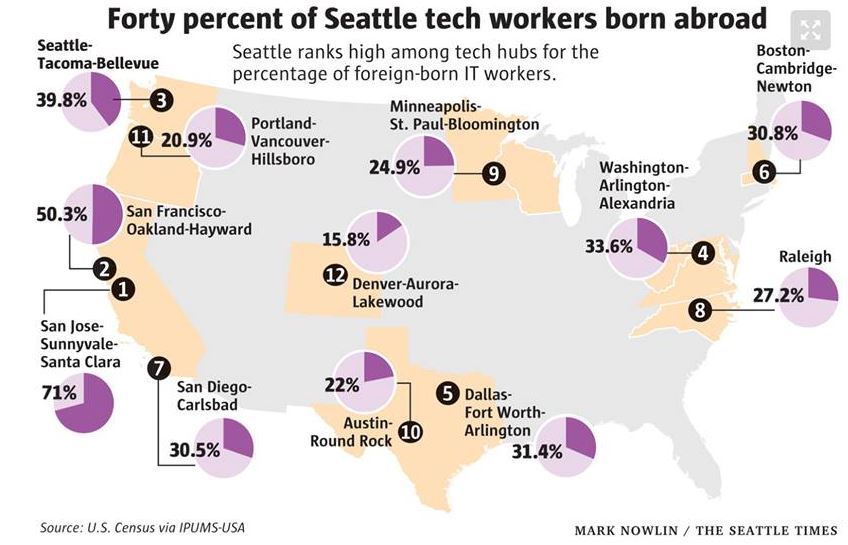
Note the correspondence of metropolitan concentrations of foreign born STEM workers and many of the pockets of low Job Quality Index workers.
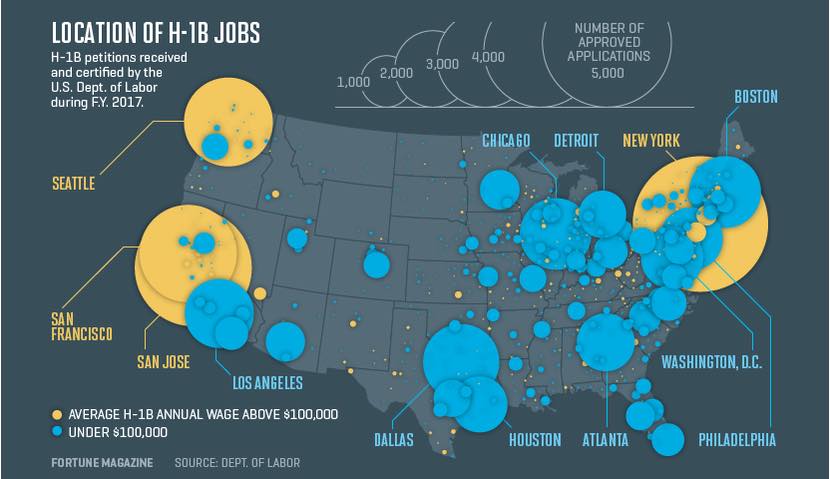
Graphic of H-1B job locations, based on Department of Labor certifications. Especially note the many (but not all) corresponding low Job Quality Index pockets in Oregon, Idaho, Utah, Arizona, New Mexico, Colorado, The Dakotas, Nebraska, Kansas, Louisiana, Florida, Georgia, The Carolinas, Maine.

Cross-Border Employment in the Windsor-Essex & Southeastern Michigan Corridor
Michigan’s low Job Quality Index worker pockets, in addition to its 8th H-1B ranking, may also be the result of TN-1 visa and Canadian cross-border commuters – see above for one example. The same may hold true for northern New York state’s low Job Quality Index worker pockets.
Upon further examination of the graphs, we see that Labor Force Participation Rate and Employment-Population Ratio (but not Job Quality Index) stabilizes/rises under Donald Trump until Corona Virus. Was his immigration restriction policies one factor?
Evidence suggests that high levels of H-1B and/or unlawful immigration, while not the only variables, strongly increases the probability of decreased Labor Force Participation Rate, Employment-Population Ratio, and Job Quality Index. These in turn, again not the only variables, increases the probability of homelessness. What is needed is further research to further explore these interrelationships and to identify additional variables.
Update:
Chaos Theory may help explain the correlations between high H-1B, et al usage, unlawful immigration, and homelessness as well as the outliers.
It is entirely possible a bifurcation is occurring depending on the Labor Force Participation Rate, Employment-Population Ratio, and/or Job Quality Index parameter(s) impacted by high H-1B usage and unlawful immigration. This bifurcation may then lead to a homelessness strange attractor emerging under certain conditions, depending on the other variables mentioned above.
